

Copyright 2015 © Nigerian Journal of Paediatrics. All Rights Reserved. . Powered by Pelrox Technologies Ltd
ISSN 03 02 4660 AN OFFICIAL JOURNAL OF THE PAEDIATRIC ASSOCIATION OF NIGERIA

|


Quick Navigation


Niger J Paediatr 2019; 46 (1):23 29
ORIGINAL
Ughasoro MD
CC
BY
Correlation of non-biological
factors with anthropometric and
haemoglobin measurements of
children under 10 years old in
southeast, Nigeria:
Community-based study
DOI:http://dx.doi.org/10.4314/njp.v46i1.5
Accepted: 28th July 2018
Abstract :
Background
eas were more likely to be moder-
Childhood malnutrition also has
ate-severely anaemic (19.7%) and
Ughasoro MD (
)
non-biological determinants and
the difference was statistically
Department of Paediatrics,
little is known about it.
significant ( p = 0.003).
Household
University of Nigeria Enugu
Objective: To
determine the
dif-
size significantly relates to under-
Campus, Enugu, Nigeria.
ferences in childrens height,
weight and childhood anaemia ( p
=
Email;maduka.ughasoro@unn.edu.
weight and haemoglobin concen-
0.002 and p = 0.036
respectively).
ng
or kakatitis@yahoo.co.uk
tration across different sociode-
Mothers education were signifi-
mographic
characteristics.
cantly related to tunting and child-
Design: The
study was
commu-
hood anaemia ( p = 0.010 and p =
nity-based study. The weight and
0.001 respectively). Childhood
height of the children were meas-
anaemia was significantly related
ured. The Z-scores were calcu-
to
mothers education ( p = 0.001)
lated. Blood was taken for haemo-
and household ( p = 0.036).
globin estimation.
Regression
Conclusions: Maternal
age and
analysis was done to determine
education, household size and
correlates.
place of resident of a child affect
Results:
More rural children
children nutritional status. Im-
(32%) have stunting and the dif-
proved education, and family plan-
ference was statistically signifi-
ning can contribute to the reduc-
cant ( p =0.003). There was no
dif-
tion in the burden of malnutrition.
ference in the prevalence of un-
derweight among under urban
Key words: Stunting,
Under-
(32.4%) and rural (33.4%) chil-
weight, Children, Nigeria, Non-
dren. Children from the rural ar-
biological determinants.
Introduction
hood anaemia and malnutrition.
15
However, little is
known about the role non-biological determinants like
There are reports of high prevalence of childhood anae-
mothers age, maternal education, household size, socio-
6-9
mia
, stunted and underweight
1-5
among children espe-
economic status and place of resident play in childhood
cially in sub-Saharan African regions. In Nigeria, anae-
anaemia and malnutrition in Nigeria.
mia contributes to 13.6% of under-five mortality ,
10
In
this study we examined the relationship between
while malnutrition contributes to a much higher mortal-
childhood haemoglobin concentration and anthropomet-
ity. Presently, a lot is known about the biological factors
ric indices like height-/length-for-age and weight-for-
like malaria, intestinal helminths, malignancies e.t.c.
age, with some non-biological determinants among chil-
which are capable to causes of anaemia and malnutrition
dren from two regions in southeast Nigeria.
11-13
.
According to reports, the infant and under five
mortality have dropped from 97 per 1000 live births and
158 per 1000 live births to 70 and 120 respectively. But
malnutrition among children under age five has worsen
Materials and Methods
nationwide with highest concerns being in the northern
Study area and population
part of the country. Wasting and stunting have increased
from 24.2% and 34.8% to 31.5% and 43.6% respec-
Abakpa and Ibagwa are an urban and a rural areas in
tively.
14
A
study has shown that beyond biological fac-
Enugu east local government area (LGA) of Enugu
tors, other non-biological factors can contribute to child-
State, while Umuahia and Nkwegwu are an urban and

24
rural areas in Umuahia North LGA of Abia State. Both
and severely stunted or underweight if their z-score were
Enugu and Abia states are in southeast Nigeria. The
< - 3 SD below the WHO median.
study was a community-based cross-sectional and 298
households were randomly selected from the four study
Haematologic Measures
localities. All the children under 10 years of age living
in
the selected households during the period of the study
The
haemoglobin estimation of the children was as-
July
August 2015 were selected. Prior to the study an
sessed using the validated HemoCue 301 haemoglobi-
advocacy visits were made to the study areas and the
nometers. The capillary blood was obtained by
approval was obtained from the relevant authorities.
venipuncture of the middle finger using microlance.
Sample size The
minimum sample
size was
calculated
A
child was categorized as anaemic if their Hb was ≤
based on sensitivity and specificity of clinical pallor of
11g/dl and non-anaemic if the Hb was > 11g/dl accord-
70% respectively , 95% confidence interval and anae-
16
ing to internationally-recognized classification criteria
mia prevalence of 42%. This gave minimum sample size
(15). All children categorized as anaemic were further
of
374 children, but 588 children were finally enrolled.
classified as mild anaemic (Hb ≥ 10 g/dl -- ≤ 11g/dl),
Patient recruitment A
simple random
selection was
to
moderately anaemic (Hb > 7 g/dl 9.9g/dl), severely
one local government area (LGA) each from the list of
anaemic (Hb < 7 g/dl). All anaemic children were given
LGAs in each of the study states. The wards in the se-
haematinics on site and referred to hospital for further
lected LGA were grouped into rural and urban. A simple
evaluation.
random selection was used to select one rural ward and
one urban ward. The wards were grouped in clusters
Data analysis
according to geographical locations and one cluster was
selected from each ward. A cluster comprises streets in
The data were entered and analyzed using SPSS version
the urban area and hermits in the rural areas. Individual
20
for windows statistical software package (SPSS Inc.,
houses of households with children under 10 years were
Chicago, IL, USA). Means and standard deviations were
identified and numbered. The households were system-
calculated. Correlation between anaemia or anthropom-
atically selected in an alternate of two, and selected
etric indices with non- biological determinants; mothers
households were informed about the study and those that
age,
education, household size, socioeconomic status
showed willingness to participate were invited to the
and
place of resident. The mothers were categorized into
recruitment centers (health centers)
three groups based on age: ≤ 24 years, 25 34 years
and
≥ 35 years, and categorized into four groups based
Household questionnaire
on
highest educational level attained: no formal educa-
tion, primary, secondary and tertiary. The children were
An
interviewer-administered questionnaire was used to
categorized into 5 socioeconomic groups based parents
education
and occupation according to Oyedeji , group
17
collection information on mothers age, mothers and
fathers highest educational level attained, mothers and
1
& 2, group 3 and group 4 & 5 as high, middle and low
fathers occupation, household size, childs age.
socioeconomic status. The children were also catego-
rized into four group based on household sizes (number
Anthropometry
of
children in a household): 1 child, 2 children, 3 chil-
dren and ≥4 children.
The World Health Organization (WHO) recommended
method was used in the measurement of recumbent
For multivariate analysis, certain determinants were
length and height to the nearest 0.1cm ( ). For a child
16
dichotomized into two groups. Based on age, mother
under 2 years or if he/she was not to stand unassisted,
were categorized into two age groups, ≤ 30 years as
his/her length was measured using measuring mat. The
young mothers and ≥ 31 years as older mothers. Based
height was measured using stadiometer with moveable
on
education, mothers were categorized into two groups;
bar and steel calibrated pole. Validated electronic
those with no formal education or primary education
weighing scale was to the measure the weight of the
were grouped as poorly-educated, while those with sec-
children to the nearest 0.01kg. A standard 10kg weight
ondary or tertiary education were grouped as well-
was used to frequently check the scale during the study.
educated. The household size was categorized into two
The children were weighed in bare feet with minimal
groups; households with ≤ 3 children as small household
clothing. The length/height and weight were independ-
and those with ≥ 4 children as large household.
ently measured by two clinicians (resident doctors and
The statistical significant was p value
≤ 0.05.
nurses) and the mean were used. The standard WHO
growth standards for boys and girls were the references
Ethics
used in the calculation of the Z-scores.
15
Those whose weight-for-age were < -2 SDs from the
The study protocol received ethical approval from the
standard mean were categorized as underweight. The
Ethics Committee of the University of Nigeria Teaching
children whose length-/height-for-age were < -2 SDs
Hospital Ituku/Ozalla, Enugu, Nigeria and Ethics Com-
from the standard mean were categorized as stunted. A
mittee of Federal Medical Centre, Umuahia, Abia State
child was moderately stunted or underweight if his/her z
The study was explained to the caregivers/parents of the
-score of height-for-age or weight-for-age were < -2
children and written consent was obtained before partici-
standard deviations below the WHO median but ≥ -3SD,
pating in the study.
25
Results
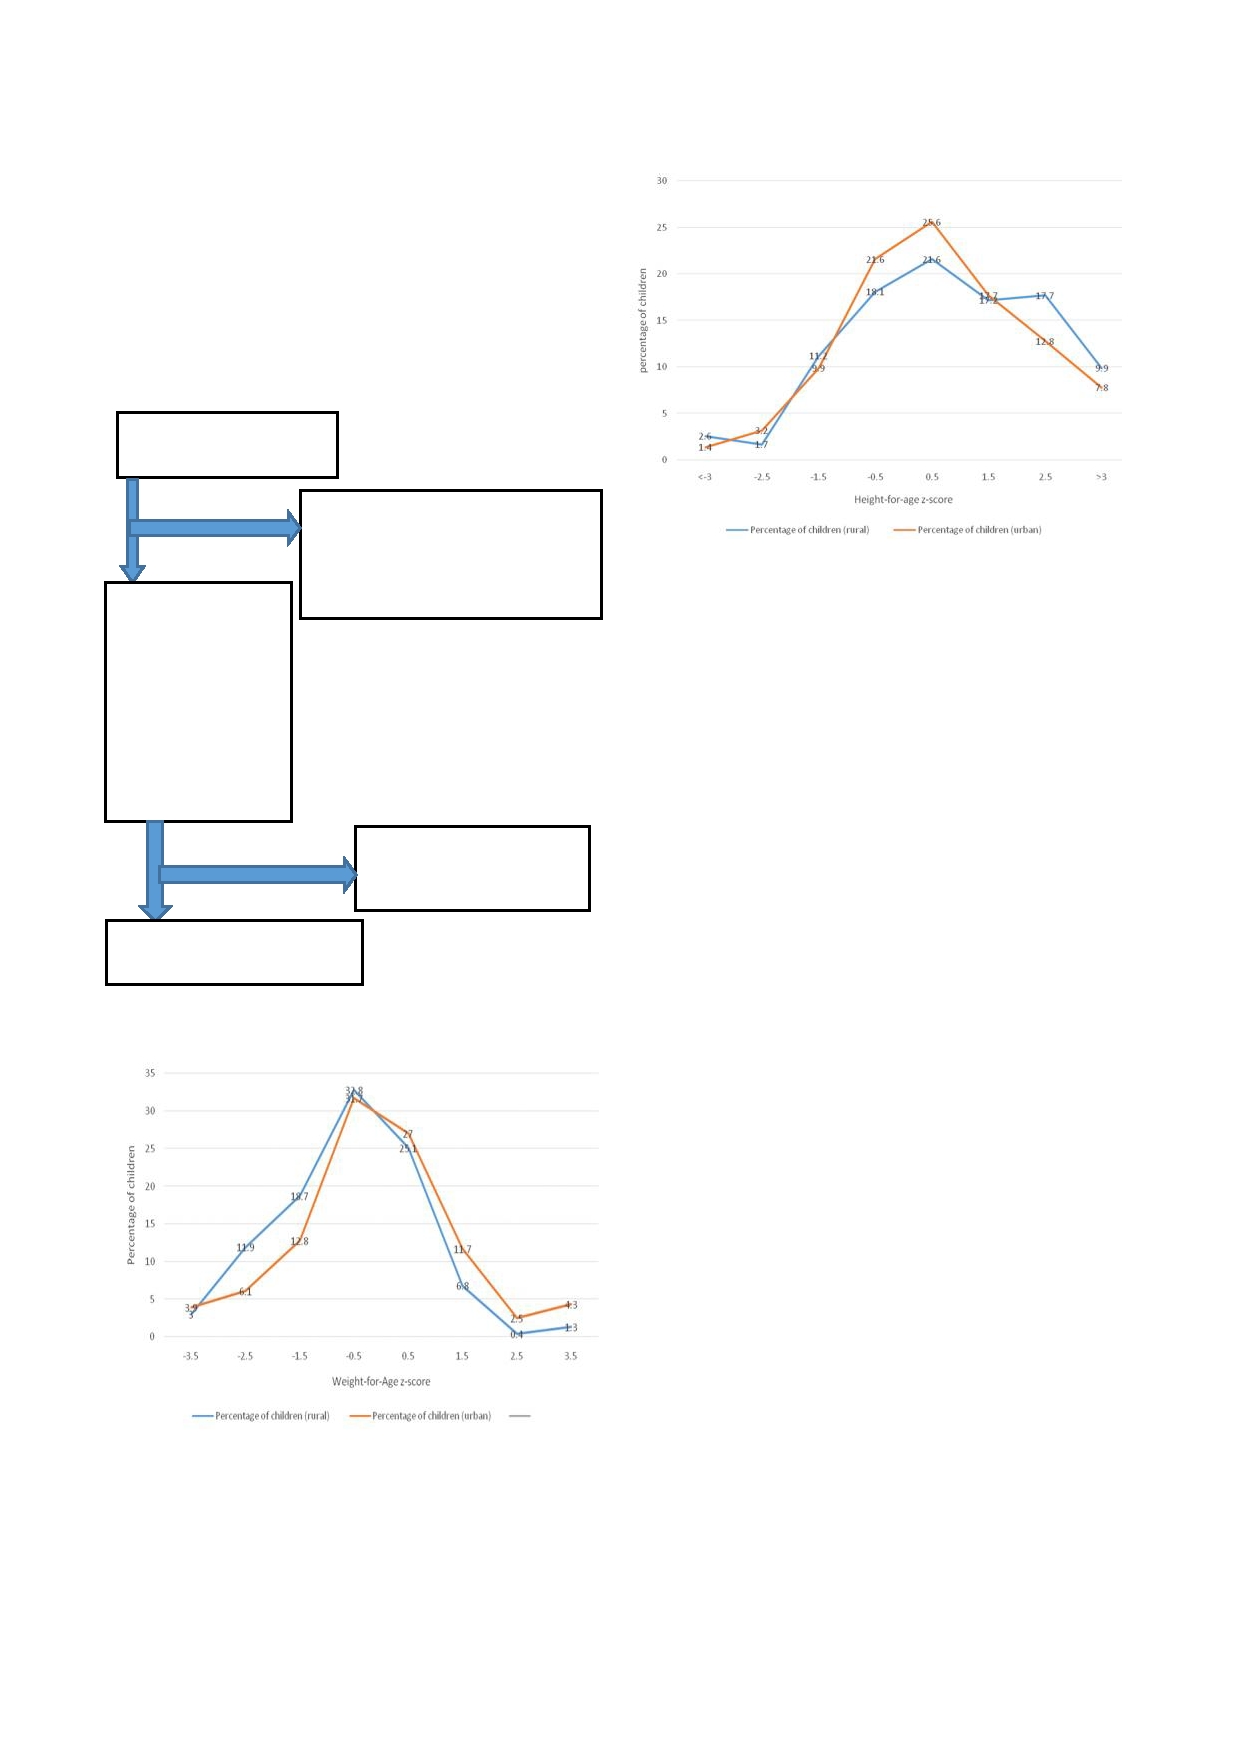
Fig 3: Height-for-age
z-score for
the children,
blue is
rural,
yellow is urban.
A
total of 552 households were identified to participate
in
the study and 298 households presented for the study,
while 254 households did not turn out, giving coopera-
tion
rate of 54%. Out of the 298 households that re-
ported, 602 children were recruited in the study. How-
ever, 14 questionnaire were excluded from the analysis,
essentially due to missing data. Thus 588 questionnaires
were finally analyzed ( Fig 1).
Fig 1: The
selection chart
Households identified to
participate (n = 552)
Parents that failed to present at the
stipulated study centres (Health
centers) and those that came when
the
study has been concluded (n =
Households that
254)
The
distribution of mothers age, educational status,
presented for the
household size, socioeconomic status of the subjects
study and gave their
were
presented in Table 1. Majority (Abakpa 54.0%,
consent for their
Ibagwa 56.5%, Umuahia 60.2% and Nkwegwu 60.0%)
children to partici-
of
the mothers in all localities were the age range of 25
pate
(n=298; 54%
34
years. Majority (Abakpa 63.8%, Ibagwa 50.0%,
cooperation rate).
Umuahia 44.1% and Nkwegwu 75.4%) of the mothers in
602
children were
all localities except Umuahia has at least secondary
reruited from the
298
households
school education. The mean household size (Abakpa
3.53 children, and Ibagwa 3.51children) in the two lo-
calities in Enugu state were higher than the mean house-
14
children were excluded
from the study due to
hold size (Umuahia 2.5 children, and 2.64 children) in
missing data. (n=14)
the two localities in Abia state.
Majority (Abakpa
52.6%, Ibagwa 51.8%, Umuahia 44.6% and Nkwegwu
588
children were included in
62.1%) of the children belong to the middle (group 3)
the
final analysis. (n=588)
socioeconomic group in all localities except in Umuahia.
Most (Abakpa 52.2%, Ibagwa 63.1%, Umuahia 49.0%
and Nkwegwu 55.0%) of the children involved in this
Fig 2: Weight-for-age
z-score for
the children,
blue is
rural,
study were male except in Umuahia.
yellow is urban
The mean age, height-for-age, weight-for-age, haemo-
globin concentration and z-scores of the children re-
cruited in this study is presented in Table 2. The mean
age was 46.43 months in the urban and 46.55 month in
the rural. The mean height-for-age z-score was -0.64
(urban) and -0.88(rural). The percentage of children that
were moderately stunted in the urban was 12.3% and in
the rural was 16.9% and the difference was not statisti-
cally significant ( p = 0.116). The
percentage of children
that were severely stunted in the urban was 6.6% and in
the rural was 15.2% and the difference was statistically
significant ( p = 0.003). The mean
weight-for-age z-score
was -0.52 (urban) and -0.63 (rural). The percentage of
children that were moderately underweight in the urban
was 17.7% and in the rural was 18.69% and the differ-
ence was not statistically significant (
p = 0.697). The
percentage of children that were severely underweight in
the urban was 12.7% and in the rural was 14.8% and the
difference was not statistically significant (
p = 0.859).
The mean haemoglobin concentration in urban was
10.94g/dl, and in the rural was 10.16g/dl. The preva-
lence of moderate anaemia in urban was 9.7% and in the
rural was 18.8%. The difference was statistically signifi

26
significant ( p = 0.003). The
prevalence of severe anae-
mia in urban was 1.7% and in the rural was 0.9%. The
difference was not statistically significant (
p = 0.394).
Table 1: Mothers
age, Educational
status, Household
size, Socio
-economic status,
Children age,
and gender
Enugu State
Abia State
Variable
Abakpa (Urban)
Ibagwa (Rural)
Umuahia (Urban)
Nkwegwu
n
(%)
n
(%)
n
(%)
(Rural)
n
(%)
Mothers Age (years) (n 1 =83;
n 2 = 62; n 3 =93; n
4 = 60 )
≤
24
17
(20.6)
12
(19.3)
9
(9.7)
14
(23.3)
25
34
45
(54.0)
35
(56.5)
56
(60.2)
36
(60.0)
≥
35
21
(25.4)
15
(24.2)
28
(30.1)
10
(16.7)
Mothers Education (n 1 =81;
n 2 = 62; n 3 = n 4 =57)
No
formal education
0
(0.0)
1
(1.6)
1
(1.8)
Primary
11
(13.8)
20
(32.3)
0
(0.0)
6
(10.5)
Secondary
52
(63.8)
31
(50.0)
2
(2.2)
43
(75.4)
Tertiary
18
(22.4)
10
(16.1)
41
(44.1)
7
(12.3)
Household Size (number of children)
50
(53.8)
(n 1 =83; n
2 = 62; n 3 = 92 n 4 =58)
2.64
Mean size
3.53
3.51
2.5
18
(31.0)
1
child
17
(20.0)
4
(6.7)
27
(29.4)
13
(22.4)
2
children
18
(22.2)
17
(26.6)
22
(23.9)
12
(20.7)
3
children
6
(6.7)
11
(17.8)
23
(25.0)
15
(25.9)
≥4
children
42
(51.1)
30
(48.9)
20
(21.7)
Socioeconomic Status (n 1 =79;
n 2 = 56; n
3 =92; n 4 =58)
4
(6.9)
1
& 2
13
(16.4)
6
(10.7)
44
(47.8)
36
(62.1)
3
42
(52.6)
29
(51.8)
41
(44.6)
18
(31.0)
4
& 5
24
(31.0)
21
(37.5)
7
(7.6)
Childs Age (mnths) (n 1 =176;
n 2 =141;n 3 =151; n
4 =120)
60
(50.0)
≤24
53
(30.1)
42
(29.8)
83
(55.0)
27
(22.5)
25
59
52
(29.4)
48
(34.0)
24
(15.9)
33
(27.5)
≥60
71
(40.5)
51
(36.2)
44
(29.1)
Childs Gender(n 1 =176; n 2 =141; n
3 =151; n 4 =120)
66
(55.0)
Male
92
(52.2)
89
(63.1)
74
(49.0)
54
(45.0)
Female
74
(47.8)
52
(36.9)
77
(51.0)
n 1 = Abakpa; n 2 = Ibagwa; n
3 = Umuahia; n 4 =
Nkwegwu
Table 2: The
prevalence of
different levels
of stunted
(height-for-age z-score ≤<
-2), underweight
(weight-for-age z-score <
-2) and
anaemia (haemoglobin estimation ≤ 11g/dl)
χ
2
Variable
Urban
Rural
p -value
n=323
n=259
Age
(months)
Mean (SD)
46.43 (32.36)
46.55 (28.42)
Mean Height-for-Age (kg) (SD)
72.0 (40.27)
87.3 (24.68)
Mean z-score (SD)
-0.64 (2.9)
-0.88 (2.43)
%moderately stunted (z-score <-2 ≥ -3)
40(12.3)
44(16.9)
13.7
0.0003
%
severely stunted (z-score < -3)
21(6.6)
39(15.2)
Mean percentage Weight-for-Age % (SD)
44.6 (20.1)
35.5 (17.6)
Mean z-score (SD)
-0.52 (1.76)
-0.63 (1.55)
%moderately underweight (z-score <-2 ≥ -3)
64
(19.7)
48
(18.6)
%
severely underweight (z-score < -3)
41
(12.7)
38
(14.8)
0.032
0.859
Haemoglobin estimation (g/dl)
Mean (SD)
10.94 (1.86)
10.16 (2.62)
%moderately anaemic (Hb 10g/dl ->7g/dl)
31
(9.7)
49
(18.8)
8.87
0.003
%
severely anaemic (Hb ≤ 7g/dl)
5
(1.7)
2
(0.9)
SD,
standard deviation; n, number of children.
30
years and 19.2% in mothers ≥ 31 years) was statisti-
The distribution of stunted, underweight and anaemia of
cally significant ( p = 0.032). The
difference in number
the
children according to mothers age, educational
of
children that were anaemicin two age categories of
status, household size and place of resident are presented
mothers (66.5% in mothers ≤ 30 years and 65.6% in
in Table 3. About equal percentage of
children (30.6%
mothers ≥ 31 years) was not statistically significant (
p =
mothers ≤ 30 years and 30.4% for mothers ≥31 years)
0.802).
were stunted in two age categories of mothers age.The
The
difference in number of children that were stunted
difference in number of children that were underweight
in
two educational categories of mothers (21.8% in
in
two age categories of mothers (12.7% in mothers ≤
poorly-educated mothers and 35.2% in well-educated

27
mothers) was statistically significant (
p = 0.010). The
nificant ( p = 0.627). The difference
in number of chil-
difference in number of children that were underweight
dren that were underweight in two household categories
in
two age categories of mothers (12.7% in poorly -
(23.6%
in small household and 13.1% in large house-
educated
mothers and 19.4% in well-educated mothers)
hold) was statistically significant ( p
= 0.002. The differ-
was not statistically significant ( p =
0.096).The differ-
ence in number of children that were anaemic in two
ence in number of children that were anaemicin two age
household categories (69.1% in small household and
categories of mothers (47.3% in poorly -educated moth-
60.7%
in large household) was statistically significant (
p
ers and 65.2% in well-educated mothers) was statisti-
=
0.036).
cally significant ( p = 0.01).
There was no statistical difference in the prevalence of
The difference in number of children that were stunted
stunted ( p = 0.191), underweight
( p = 0.917) or anaemia
in
two household categories (35.6% in small household
( p = 0.463) between urban and rural
resident children.
and 33.6% in large household) was not statistically sig-
Table 3: Factors
that may
affect stunted
(height-for-age z-score <-2),
underweight
(weight-for-age z-score <
-2) and
anaemia
(haemoglobin estimation ≤ 11g/dl) using multivariate analysis.
Stunted
Underweight
Anaemia
χ
2
n
(%)
χ
2
n
(%)
χ
2
variables
n
(%)
Adjust OR
p
value
(p-value)
(p-value)
(p-value)
95%CI
Mothers age
≤
30 (n=338)
103
(30.6)
0.001
43
(12.7)
4.637
225
(66.5 )
0.063
0.611
≥
31(n=244)
74(30.4)
(0.970)
47
(19.2)
(0.032)
160
( 65.6 )
(0.802)
(0.39-0.96)
Mothers education
No
formal education & Primary
23
(21.8)
6.579
13
(12.7)
2.775
50
(47.3)
10.741
0.52
0.49
(n=104)
168
(35.2)
(0.010)
93
(19.4)
(0.096)
312
(65.2)
(0.001)
(0.32-0.86)
(0.32-0.76)
Secondary & Tertiary (n=478)
Household size
133
(35.6 )
0.236
88
(23.6 )
9.472
258
(69.1)
4.399
2.07
1.46
≤ 3
children (n=373)
70
(33.6 )
(0.627)
27
(13.1 )
(0.002)
126
(60.7)
(0.036)
(1.29-3.31)
(1.02-2.08)
≥4
children (n=208)
Place
of resident
78
(23.0)
1.712
113
(33.3)
0.011
226
(66.7)
0.539
Urban (n=339)
45
(18.5)
(0.191)
82
(33.9)
(0.917)
169
(69.4)
(0.463)
Rural (n=243)
The distribution of weight-for-age for both rural and
high with no inter-district variation between urban and
urban children is represented in Figure 2. There was an
rural. Studies among Kazakhstan and Indonesia children
reported lower prevalence respectively
18,21
uneven distribution with most of the population skewed
.
This could
towards the left side of the mean in both urban and rural.
be
attributed to seasonal variation with farming seasons
A
greater proportion of the both urban and rural children
in
the rural and nutritional deprivation when schools
had weight that was below the standard weight for age.
session in the urban.
Thus there is a higher tendency for a child to be under-
weight than have normal weight or being overweight.
The proportion of children that were anaemic was high
and are well documented: Assefa et al ,
Ughasoro et
1
al ,
and Dangour et al
, in
their studies
among Ethio-
11
18
The distribution of height-for-age for both rural and
urban children is represented in Figure 3. There was an
pian, Nigeria and Kazakhstan children respectively re-
uneven distribution with most of the population skewed
ported high prevalence of moderate-severely anaemic in
towards the right side of the mean in both urban and
children. In this study, the prevalence in the rural was
rural. Greater proportion of both urban and rural chil-
higher compared to the children in the urban and the
dren had normal height. Thus there is higher tendency
difference was statistically significant. Could it be that
for a child to have normal height than to be stunted.
most children in the rural tend to consume non-heme
iron as their main source of dietary iron.
22
Lack of at-
tention to the nutritional content of food children feed
on
could be contributory.
23
The children of well-
Discussion
educated mothers have more tendency to be stunted and
anaemic compared to the children of poor educated
mothers. This is not in accord with expected variation
24
The prevalence of stunted growth was low among chil-
dren in both urban and rural areas. This was similar to
since low maternal education is expected to affect chil-
15% that Dangour et al
reported but contrast to what
dren nutritional status adversely
25
18
.
There is no clear
was reported by Fernando et al.
19
The prevalence was
hypothesis that can explain this. Could it be that most
higher among rural school children and similar to what
enlightened mother practice exclusive breastfeed for a
has been reported. The overall relatively equal preva-
20
shorter period before introducing cereal-based feeds
lence obtained in the two localities could be due to var-
early and often given their children iron supplements?
ied dynamics that exist in these different environment.
Studies have shown that phytates in some cereal feeds
The proportion of children that were underweight was
chelate calcium and reduce its absorption. Also presence

28
of
high iron content in the intestine reduces the absorp-
bin genotype. Information on these biological determi-
tion of calcium, with resultant nutritional rickets and
nants will give insight into the complexity of factors that
reduced linear length of the bones and height in general.
determine the nutritional status of a child. Another limi-
According to the WHO malnutrition classification, when
tation is the use of Oyedeji an old model for categoriz-
the prevalence of stunting, and wasting are ≥ 40% and ≥
ing socio-economic class. A more recent tools like use
15%, it is considered as very high and serious if the
of
household assets and household financial income to
range of 30 -39.9% and 10 14.9% in the community
generate quartile or quintile groups, would have been
respectively.
26
In
this study, the prevalence of stunting
more appropriate. Unfortunately, the data collected
in
the study ranged from 18.9% in the urban to 32.1% in
could provide the necessary indices require for such
the rural. Therefore, can be regarded as a serious public
calculation.
health problem in the rural, while efforts should be to
keep it down in the urban.
The prevalence of underweight and anaemia among chil-
Conclusion
dren in large households were significantly higher and
this is similar to what have been reported.
27,28
This could
The prevalence of stunted, underweight and aneamia in
be
attributed to increased concentration of food con-
southeast Nigeria was high. There are multiple causes of
sumption of resources in the family.
29
It
stand to reason
malnutrition in Nigeria children, but rural dwelling,
that increase in family size lead to stretch on family in-
large household size, and low mothers educational level
come
with resultant reduce food availability and under-
are
prominent among the non-biological factors. There-
nutrition, But there are various cofounding variables:
fore
any intervention aimed to improve on the nutri-
household income, and maternal education, that have to
tional status of children in a given community should
be
considered before drawing any conclusion. One ma-
make every effort to improve the overall maternal edu-
jor limitation of the study was none inclusion of biologi-
cation, improve standard of living in the rural communi-
cal determinants like malaria, intestinal helminths, bac-
ties and improved family planning strategy.
teremia, human immunodeficiency virus and haemoglo-
References
1.
Assefa S, Mossie A, Hamza L.
5.
Koram KA, Owusu-Agyei S,
9.
Gupta SK, Agarwal SS,
Prevalence and severity of ane-
Utz G, Binka FN, Baird JK,
Kaushal R, Jain A, Gupta VK,
mia among school children in
Hoffman SL, Nkrumah FK.
Khare N. Prevalence of ane-
Jimma town, southeast Ethio-
Severe anaemia in young chil-
mia among rural population
pia. BMC
Hematology 2014, 14
dren after high and low ma-
living in and around of rural
(3) http://
laria transmission seasons in
health and training center,
biomedcentral.com/2052-
the Kassena-Nankana district
Ratua Village of Madhya
1839/14/3
of
Northern Ghana. Am
J Trop
Pradesh. Muller J
Med Sci
2.
World Health Organization.
Med Hyg 2000;62(6):670-
Res , 2014; 5(1):15-18
Worldwide prevalence of anae-
674.
10. Muoneke V.U, Ibekwe R.C.,
mia 1993-2005, WHO Global
6.
Ricci JA, Becker S. Risk fac-
Nebe-Agumadu H.U., Ibe
Database on Anaemia. Geneva:
tors for wasting and stunting
B.C. Factors associated with
World Health Organization,
among children in Metro
mortality in under-five chil-
2008.
Cebu, Philipines. Am
J Clin
dren with severe anemia in
3.
Murray CJL, Lopez AD. The
Nutr1996;63:966-975.
Ebonyi, Nigeria.
Indian Pedi-
global burden of disease: A
7.
Wenfang Yang, Xu Li, Shuip-
atr 2012;49(2):119-23
comprehensive assessment of
ing Zhang, Liming Liu, Xiang
11
Ughasoro MD, Emodi IJ, Oka-
mortality and disability from
Wang, Weimin Li. Anemia,
for HU, Ibe BC 2015 Preva-
diseases, injury and risk factors
malnutrition and their correla-
lence and risk factors of anae-
in
1990 and projected to
tions with socio-demographic
mia in paediatric patients in
2020.In,Murray CJL, Lopez
characteristic and feeding
south-east Nigeria, South
Afri-
AD. Global Burden of Disease
practices among infants aged
can J Child Health 9(1):14-
and Injury series, Vol. 1. UK:
0
-18 months in rural areas of
17.doi:10.7196/SAJCH.760
Havard University Press,
Shaanxi province in north-
12. Callis JC, Phiri KS, Faragher
1996:1-43.
western China: a cross-
EB, Brabin BJ, Bates I,
4.
Ughasoro MD , Ikefuna AN,
sectional study. BMC
Public
Cuevas LE, de Haan RJ, Phiri
Emodi IJ, Ibeziako SN, Nwose
Health 2012,12:1127.
Avail-
AI, Malange P, Khoka M. et al
SO. Audit of Blood Transfu-
able from http://www.biom
Severe anaemia in Malawian
sion Practices in the Paediatric
edcentral.com/1471-
children. N
Eng J
Med 2008;
Medical Ward of A Tertiary
2458/12/1127.
358(9):888-899
Hospital in Southeast Nigeria:
8.
Bassam Alzain. Anemia and
13. Stoltsfus RJ, Chwaja HM,
A
one year review. East
Afric
nutritional status of pre-school
Montresor A, Albonico M,
Med J 2013;90(1):5-11.
children in North Gaza, Pales-
Savioli I, Tielsch JM. Malaria,
tine. IJSTR
2012;1(11):86-91.
hookworm and recent fever

29
13. Stoltsfus RJ, Chwaja HM,
19. Fernando SD, Paranavitane
24. Fleming AF, Werblihska B.
Montresor A, Albonico M,
SR, Rajakaruna J, Weeras-
Anemia in childhood in
Savioli I, Tielsch JM. Malaria,
inghe S, De Silva D, Wickre-
Guinea Savane of Nigeria.
hookworm and recent fever are
masinghe AR 2000. The
Ann Trop Paediatr
related to anaemia and iron
health and nutritional status of
1982,2:1611-173
status indicators in 0- to 5-yr
school children in two rural
25. Victoria CG. The association
old Zanzibar children and these
communities in Sri Lanka.
between wasting and stunting:
relationships change with age.
TMIH , 2001,5(6) 450-452
an
international perspective J
J Nutr 2000;130(7):1724-1733
20. Darteh EKM, Acquah E,
Nutr 1992, 122, 1105-1110
14. UNICEF. New MICS5 data
Kumi-Kyereme A. Correlates
26. Bassam Al-zain. Impact of
highlights nationwide drop in
of
stunting among children in
socioeconomic conditions and
infant mortality and increase in
Ghana. BMC
Public Health
parasitic infection on hemo-
child malnutrition in Nigeria
2014, 14 :504. http://
globin concentration among
UNICER 2017 https://
www.biomedcentraal.com/147
children in Um-Unnasser vil-
www.unicef.org
1-2458/14/504
lage, Gaza Strip. Turk
J Med
15. The WHO child growth stan-
21. Syahnul S, Kimura R., Tsuda
Sci 2009, 39(1):53-58
dards World Health Organiza-
A,
Susanto T, Saito R, Ahmad
27. Hein NN, Hoa NN. Nutritional
tion 2009. Accessed in January
F.
Prevalence of underweight
status and determiants of mal-
2015. Available in http://
and overweight among school
nutrition in children under
www.who.int/growthref/en/
-
aged children and its asso-
three
years of age in Nghean
16. Kalantri A, Karambelkar M,
ciation with childrens socio-
Vietnam. Pak
J Nutr
20098
Joshi R, Kalantri S, Jajoo U.
demographic and lifestyle in
(7):958-996
Accuracy and reliability of
Indonesia. International
J
28. Cleland J, Bernstein S, Ezeh
pallor for detecting anaemia: A
Nursing Sciences , 2016,3
A,
Faundes A, Glasier A, In-
hospital-based diagnostic accu-
(2):169-177
nis J: Family planning: the
racy
study. PLoS
One 2010;
5
22.
Motbainor A, Worku A,
unfinished agenda. Lancet
(1):e8545.doi:10.1371/
Kumie A. Stunting is associ-
2006, 368(9549):1810-1827
journal.pone.0008545
ated
with food diversity while
29. Giroux CS: Child stunting
17. Oyedeji GA. Socioeconomic
wasting with food insecurity
across schooling and fertility
and cultural background of
among underfive children in
transitions: evidence from Sub
hospitalized children in Ilesa.
East and West Gojjam zones
-saharan Africa. Demogr
Nig J Paediatr 1995;12:111-
of
Amhara region, Ethiopia
Health Res 2008;57(4):2-5.
117.
PLoS ONE 2015, 10 (8):
18. Dangour AD, Hill HL, Ismail
e0133542.doi:10.1371/
SJ. Height, weight and haemo-
journal.pone.0133542
globin status of 6 to 59-month-
23. Kaya M, Pehlivan E, Aydogdu
old Kazakh children in Kzyl-
I,
Genc M, Gunes G, Kaya E,
Orda region, Kazakhstan.
Kuku I. Iron deficiency anae-
European Journal of Child
mia among students of two
Nutrition, 2002, 56:1030-1038
primary schools at different
socioeconomic conditions in
Malatya, Turkey. Inonu
Uni-
versitesi Tip Fakultesi Dergisi
2006, 13(4):234-242