

Copyright 2015 © Nigerian Journal of Paediatrics. All Rights Reserved. . Powered by Pelrox Technologies Ltd
ISSN 03 02 4660 AN OFFICIAL JOURNAL OF THE PAEDIATRIC ASSOCIATION OF NIGERIA

|


Quick Navigation


Niger J Paediatr 2017; 44 (1): 7 13
ORIGINAL
Adam VY
Prevalence and comorbidities of
Isah IA
childhood overweight and
obesity among school aged
children in an urban settlement
in Benin City, Nigeria
DOI:http://dx.doi.org/10.4314/njp.v44i1.2
Accepted: 6th December 2016
Abstract :
Background:
The
weight respondents was 7.7% and
prevalence of childhood over-
3.1% for obesity giving a com-
Adam VY (
)
weight and obesity is rising
bined proportion of 10.8% while
Department of Community Health
worldwide and its impact span-
that for underweight was 11.8%
Isah JA
ning through adolescence to adult-
amongst the study respondents.
Department of Child Health
hood.
The females, 18 (16.6%) had a
University of Benin Teaching Hospital
Objectives: This
study aimed
to
significantly higher proportion of
Benin City Nigeria.
determine the prevalence of over-
overweight and obesity than the
Email: Vincent.adam@uniben.edu.ng
weight and obesity and the occur-
males, 3 (3.5%) [p = 0.003]. The
rence of high blood pressure and
prevalence of hypertension was 6
elevated blood glucose among
(3.1%) and elevated blood glucose
school aged children in an urban
was 4 (2.1%).
settlement in Benin City, Nigeria.
Conclusion: The
prevalence of
Design: A
cross-sectional, de-
overweight was 7.7% while that
scriptive study was utilized.
for obesity was 3.1%. Also, the
Subjects and setting: A total of
prevalence of hypertension and
195 school aged children residing
elevated blood glucose was 3.1%
in
households in the selected ward
and 2.1% respectively amongst the
were recruited for the study car-
school aged children and females
ried out between 2014 and 2015.
had a significantly higher propor-
Outcome measures: Anthropom-
tion of overweight and obesity
etric measurements were recorded
than males in the study. There is a
and used to determine the body
need for public enlightenment to-
mass indices (BMI) of the chil-
wards promoting healthier lifestyle
dren. Also blood pressure meas-
choices and screening of disease
urements and random blood sug-
conditions early in childhood.
ars of the respondents were deter-
mined to ascertain the blood pres-
Keywords: Prevalence,
Comor-
sure
and glycaemic status of the
bidities, Overweight and obesity,
children.
School aged children, Nutritional
Results: The
proportion of
over-
status.
Introduction
There is a global increase in the prevalence of over-
weight and obesity. The worldwide prevalence has dou-
Obesity has been recognized for thousands of years as
bled between 1980 and 2014, at present 35% of adults
>20 years are overweight with 11% obese. In 2012,
[]
seen in Stone Age Statues that depicted the excessive
roundness of the female human form. Hippocrates first
about 40 million children < 5 years were OWOB and the
pointed out the possible negative health effects of obe-
prevalence was 30% higher in developing countries than
in
developed countries.
5
sity when he observed that very fat individuals were
more likely to die from sudden death than thin individu-
als. It was commonly held belief that the heavier a
1
The children who are OWOB face the twin burden of
child, the healthier he was, in order words the bigger
diseases in childhood as well as increased morbidity and
the
better. This attitude began to change by the late 19
th
mortality in adulthood. In childhood, they often have
century and has continued to the present time with in-
breathing difficulties, increased risk of fractures, hyper-
creasing recognition of the associated health risks of
tension and psychological problems while in adulthood
overweight and obesity (OWOB).
2,
they have a higher risk of premature deaths, disability

8
and obesity. The problem of OWOB in children is sig-
6
The calculated minimum sample size was 155, with an
nificant because of the associated health burden on the
addition of 16 (non-response rate of 10%), 171 was ob-
child and its implication on the health of the future adult
tained as the sample size. For the purpose of this study
population.
7
195
school aged children were recruited.
In
the United States (US), the third National Health and
Nutrition Surveys (NHANES) showed that there have
8
A
cluster sampling technique was utilized for this study.
been
increases of OWOB in all age groups and across
The
urban settlement is divided into two by a major road
both
gender over a period of 20 years from the
on
which the LGA secretariat is located. The area on the
NHANES II and NHANES III and that girls were more
left of the major road was selected by simple random
affected than boys. A similar increase was also reported
sampling through balloting and this formed a cluster. In
in
Japan where the frequency of obese school children
the selected area, a total of 332 houses were enumerated
between the ages of 6-14 years increased from 5% to
consisting of 525 households. Those households that the
10% from 1974 to 1993.
9
parents gave their permission and who had children that
met the inclusion criteria were selected for the study. A
In
a related study done to determine the prevalence of
total of 195 children were selected for the study.
OWOB using data on 720 children aged 6-18 years in
The tool for data collection was a researcher-
Ile-Ife, Nigeria. The results showed that 2.8% and 0.8%
administered structured questionnaire, pre-tested in Isio-
were overweight and obese respectively. Females were
hor community in Ovia North-East LGA, Benin City.
more likely than males to be obese.
10
Similar findings
The
questionnaire also contained details of the physical
were
obtained in another study conducted in Calabar,
examination of the children including their weights,
Nigeria, among 1,005 children and adolescents aged 6-
heights, BMI, blood pressure and random blood sugar.
18
years resident within the state. The results showed
Research assistants comprised of four doctors and four
that
the prevalence of obesity was 2.3% in the children
final year medical students who were trained on how to
aged
6-12 years. The BMI was higher in females than in
obtain information using the questionnaire and carry out
the
males. A related study was done in the three sena-
11
anthropometric measurements. This was done in order to
torial districts in Benue State to assess the demographic
ensure reliability of the information and the measure-
variation in the prevalence of OWOB using 3240 chil-
ments obtained.
dren aged 9 to 16 years. The results showed that 88.5%
had normal weights, 9.7% were overweight and 1.8%
Measures
were obese. Females (20.3%) were more likely to be
overweight than boys (16.2%).
12
The
heights of the respondents were measured using a
stadiometer. The children pulled off their footwear and
stood on the stadiometer (Axiom RGZ 160) accord-
®
There
is a dearth of information on the prevalence and
comorbidities of childhood overweight and obesity in
ing to the National Health and Nutrition Survey
(NHANES) protocol.
[16]
school aged children within Nigeria and particularly in
Also, the weights of the children
Benin City. This study hopes to assess the presence of
were measured with their normal household wears only.
OWOB and associated comorbidities among school
They were asked to empty their pockets, pull off sweat-
aged children in Egor Local Government Area, Edo
ers
or vests, belts and wrist watches and void before
having their weights taken.
[16]
State. The information derived from this study would
The
children were
weighed using a Seca
®
therefore
add to the available data on childhood over-
digital
electronic scale (Seca
weight and obesity and may contribute to the formula-
gmbh & Co, Germany) with a calibration of 0.1kg. The
tion of health related policy at the school and Local
Body Mass Index (BMI) was calculated using the for-
mula, BMI= Weight (Kg) / Height (m ). Blood pres-
2
2
Government level.
sures were also taken with the children sitting in a com-
fortable chair using a mercury sphygmomanometer us-
ing
standard procedures.
17
The
blood pressure was
Material and methods
measured twice and the mean value calculated and re-
corded for each child.
This descriptive cross-sectional study was carried out in
Uselu, an urban settlement and headquarters of Egor
In
addition, the blood sugars were determined using
Accucheck blood sugar kit. The thumbs of the children
®
Local
Government Area (LGA) in Benin City, Nigeria.
Egor LGA which is one of the four LGAs making up
were cleansed with an alcohol swab, and pricked with an
Benin City comprises of 10 political wards. The LGA
individual sterile lancet. A drop of blood was applied to
has an estimated population of 420,643 people, with
the test strip and the blood sugar read off the screen of
220,226 children aged <15years (2014 estimated popu-
the
meter. The instrument was standardized using the
lation).
13
The
study participants included school aged
code strip standard that came with the kit. The kit was re
children (6-12 years) residing in households within the
-standardized after every 30 readings or before each
selected houses in the study area.
days activity whichever came first. The values obtained
The minimum sample size for the study was determined
were documented. A parent/care giver was present dur-
using the Cochran formula for simple proportion. n =
14
ing the examinations.
z
pq/d where p = 11.4% (proportion of overweight Ni-
2
2
gerian children in a study carried out in Uyo, Nigeria.
15

9
Data analysis
Results
The data was analyzed using IBM SPSS version 21.0
A
total of 195 children were surveyed. More than half,
(SPSS for Window Inc; Chicago, LL, USA) Statistical
109 (55.9%) of the respondents were females. The mean
software and the WHO Anthroplus . The socio-
®
age
of the children was 8.6(± 2.0) years with 96 (49.2%)
economic class was obtained using the protocol devel-
of
them aged between 6-8 years. Majority, 117 (60.0%)
oped
by Olusanya et al. The purchase and consumption
18
of
the participants were in the lower socio-economic
of
sugar sweetened beverages was grouped into
class, with 189(96.9%) being Christians. About a tenth
"often" (if consumed at least three times weekly) and
21(10.8%) were from extended families and136 (69.7%)
"rarely" (if consumed at most once monthly). The age
were Benin. Table 1
was summarized as mean ± standard deviation (SD),
while the age-groups and BMI category of the respon-
Table 1: Socio-demographic
characteristics of
the respondents
dents were represented as proportions. Fishers exact
Socio-demographic
Frequency
Percent
test was utilized to determine association with level of
characteristic
(N
= 195)
(%)
significance set at p ≤ 0.05.
Age group (years)
6-8
96
49.2
The BMI of the respondents was further classified using
9-10
59
30.3
the WHO Growth Reference for school-aged children
11-12
40
20.5
and
adolescents according to their age and gender.
19
The respondents with BMI < -2SD for age and sex
Gender
(thinness and severe thinness) were classified as under-
Male
86
44.1
weight, between the ≥ -2SD to ≤ 1SD were classified as
Female
109
55.9
normal; >1SD were classified as overweight; while >2
Socioeconomic class
SD
were classified as obese.
Upper
21
10.8
The
mean blood pressure of the respondents were classi-
Middle
57
29.2
fied using the standard chart for age, sex and height.
20
Lower
117
60.0
The values ≤ 95 percentile were classified as normal, >
th
Ethnicity
95
percentile was classified as hypertension. The ran-
th
Benin
136
69.7
dom blood sugar values were classified thus: ≤ 140 mg/
Igbo
20
10.3
dl
as normal and > 140 mg/dl as elevated.
Esan
15
7.7
Isoko
11
5.6
Ethical considerations
Urhobo
8
4.1
Yoruba
5
2.6
Ethical clearance was obtained from the Ethics and Re-
Religion
search Committee of the University of Benin Teaching
Christian
189
96.9
Hospital (UBTH) [protocol number ADM/E22/A/VOL
Muslim
6
3.1
VII/1141].
Also, permission was obtained from the
Heads of the communities within the selected EAs and
Family Type
the parents/ guardians of each of the selected children.
Nuclear
174
89.2
Assent was obtained from children older than 8 years of
Extended
21
10.8
age. The children who had abnormalities detected
(elevated blood pressure and blood sugar) were referred
Most, 160(82.1%) of the respondents took snacks in-
to
the Paediatric Cardiology and Endocrinology Units of
between meals and 139(71.3%) had pastries as the
UBTH respectively. The underweight and overweight/
snack. Only, 3(1.5%) of the respondents took either
obese children were referred to the Paediatric Gastroen-
fruits or groundnut (legumes) and majority, 129(66.2%)
terology/ Nutrition Unit of the same hospital for man-
had snacks once or twice daily. Sugar sweetened bever-
agement and follow-up after educating them on adequate
ages were bought in 81(41.5%) of the homes of the
nutrition and importance of physical activities. All data
respondents. Table 2
obtained were treated with utmost confidentiality.
Of
the 195 respondents, 151(77.4%) had normal BMI,
Limitations
while, 15(7.7%) and 6(3.1%) were overweight and
obese respectively. Also, 23(11.8%) who were under-
Some of the information obtained from the children may
weight. Almost all the respondents, 189(96.9%) and 191
have been subject to bias from recall and self-reporting.
(97.9%) were normotensive and normoglycaemic re-
In
addition, the blood sugar obtained from the respon-
spectively. The prevalence of hypertension and elevated
dents was a random blood sugar instead of fasting blood
blood sugar was 4(3.1%) and 2(2.1%) respectively.
sugar or 2hr post prandial (2hrPP) which would have
There was no significant difference in association be-
been a better marker of the glycaemic status of the
tween the glycaemic status of the respondents and the
school aged children. However, this would have been
BMI classification of the respondents (p = 1.000). How-
difficult to obtain in a community study.
ever, an equal proportion, 3(50.0%) of the respondents
with elevated blood pressure were overweight or had
normal weights. This association between the elevated
10
blood pressure and BMI of the respondents was statisti-
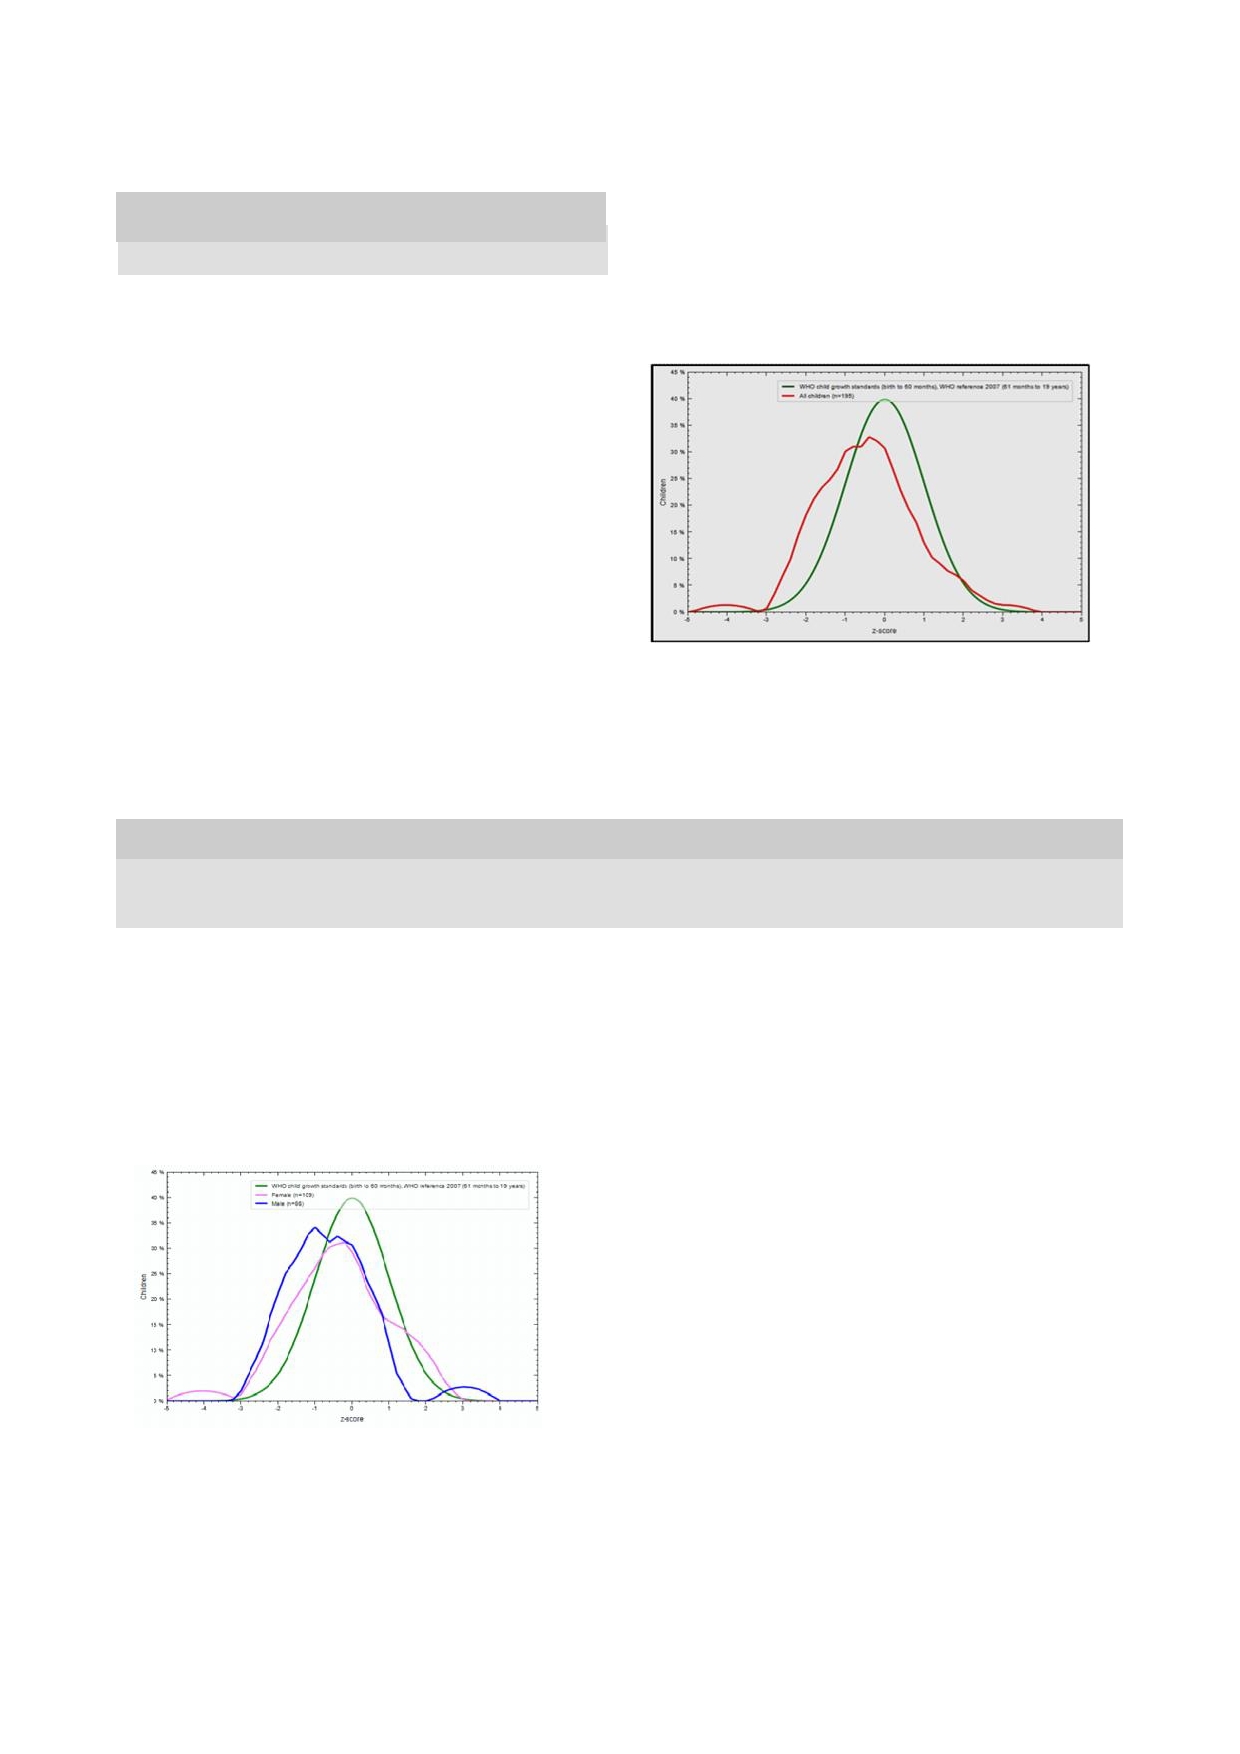
The mean BMI z score of the respondents was -0.46 (SD
cally significant (p = 0.020). Table 3
1.23) and ranged from -4.04 to +3.03 which indicates
that on the average, the study population consisted
Table 2: The
snacking pattern
(intake, daily
frequency and
the
mainly of normal weight children although there was a
type of snack taken in between meals) of the respondents
wide spectrum from severe thinness (underweight) to
Variable
Frequency (N)
Percent (%)
obese respondents. Fig 1
Intake of snacks
No
35
17.9
Fig 1: Distribution
of the
BMI for
age z-scores
of the
respon-
Yes
160
82.1
dents compared with the WHO growth reference for school
Type of snack
aged children and adolescents
None
35
17.9
Pastries*
139
71.3
Soft drinks
9
4.6
Ice
cream
6
3.1
Fruit
3
1.5
Groundnut
3
1.5
Daily frequency
None
35
17.9
1-2
129
66.2
3-4
28
14.4
≥
5
3
1.5
Purchase of sugar sweetened beverages
Often
81
41.5
Rarely
114
58.5
Total
195
100.0
The mean BMI z score for the male respondents was -
*Pastries: Biscuits, Egg roll, Cake, Meat pie.
0.61, SD 1.13 while that for the females was -0.35, SD
1.31. Thus, both gender on the average had normal BMI.
However, the males had a greater tendency to under-
weight than the female respondents. Fig 2
Table 3: The
blood pressure,
glycaemic status
and the
BMI of
the respondents
BMI
category
Underweight
Normal
Overweight
Obese
Variable
Frequency (%)
Test statistic
Glycaemic status
Normal
23(12.0)
147
(77.0)
15
(7.8)
6
(3.2)
Fishers exact = 0.889
Elevated
0
(0.0)
4(100.0)
0
(0.0)
0
(0.0)
p = 1.000
BP status
Normal
23
(12.2)
148
(78.3)
12
(6.3)
6
(3.2)
Fishers exact = 8.886
Elevated
0
(0.0)
3
(50.0)
3
(50.0)
0
(0.0)
p = 0.020
Fig 2: Distribution
of the
BMI for
age z
score of
the respon-
BenueState and Ile-Ife, Osun State in Nigeria and
12
10
dents according to gender compared with the WHO growth
another study carried out in Khartoum, Sudan with
21
reference for school aged children and adolescents
reported prevalence of 9.7%, 13.7% and 14.8% respec-
tively. The observed prevalence of overweight in this
study was higher than findings reported in several stud-
ies
done in Southern Nigeria with reported prevalence of
6.7%, 5.7%, 4.1% and 1.6% in Abia, Port Har-
22
24
and Owerri respectively. The pro-
25
court, Anambra
23
portion of obesity observed in this study was akin to
findings from several studies carried out in Nigeria, such
as: 3.0% in Lagos 2.8% in Ile-Ife, and 2.3% reported
26
10
in
Calabar, but higher than 1.8% in Benue State and
11
12
Owerri including 0.8% in Abia. The value was how-
25
22
ever lower than 5.9%, 5.2% and 10.5% reported in stud-
ies done in Port Harcourt, Ile-Ife in Nigeria and Khar-
23
27
toum, Sudan respectively.
21
Discussion
The
varying values could be because of the different
study populations comprising of only school aged chil-
The
prevalence of overweight in this study was 7.7%
dren, a combination of school aged children and adoles-
which is lower than those reported in studies done in
cents up to 18 years or adolescents only. This study re-

11
cruited school aged children only. Furthermore, the
sugar sweetened beverages will increase the caloric in-
method used in defining overweight and obesity differed
take of the children and could result in weight gain
as
some of the studies used the BMI alone or BMI per-
which might predispose the respondents to overweight
and obesity and their consequences.
34
centiles. Also, different BMI percentile charts are avail-
able such as the NCHS/WHO chart of 1977 and the
The study also revealed that almost all of the respon-
2007 WHO percentile charts used in this study. It has
dents were normotensive and normoglycaemic. The rela-
been reported that these two reference charts differ sig-
tively low prevalence of elevated blood pressure and
nificantly as the 2007 WHO chart used a more diverse
blood sugar is commendable and could be a reflection of
population in the sampling and also used the growth
the low proportion of overweight and obese respondents
curve of the exclusively breast fed child as the stan-
in
this study. The proportion of respondents with high
dard. There is a need for uniformity in the assessment
27
blood pressure in this study was 3.1% which is lower
of
OWOB amongst children to allow for adequate com-
than 4.7%, 4.9%, and 5.6% reported in Port Harcourt,
Nigeria, Khartoum, Sudan and Sarvabad, Iran
23
21
35
parisons and monitoring to be done.
re-
spectively. There was no significant association between
The large proportion of normal weight school aged chil-
OWOB and elevated blood sugar amongst the study
dren when compared with the WHO child growth stan-
respondents as all of those with elevated blood sugar
dards is encouraging as it indicates that over two-thirds
had normal BMI z-score.
of
the respondents likely have optimal nutritional status.
It
however does not exclude covert micronutrient defi-
Furthermore, half of those with elevated blood pressure
ciency. In addition, over a fifth of the respondents were
were overweight and this association was statistically
malnourished if proportions of overweight, obese and
significant. In addition, 2.0% of the respondents with
underweight respondents are combined. This may indi-
normal BMI had elevated blood pressure in contrast to
cate that some of the objectives of the National School
the overweight respondents where a quarter had elevated
Health Policy such as the improvement of the nutritional
blood pressure. Obesity is known to be associated with
status of school children through provision of at least
elevated blood pressure due to the increased salt reten-
tion and hyperinsulinaemia
36,37
one adequate meal a day to school children and regular
that is linked to this con-
deworming are being poorly implemented in the study
28
dition. The finding in this study is similar to that of a
study done in Seychelles in which the obese boys and
38
area which may necessitate further studies involving the
schools in order to assess the school feeding services in
girls had three and five times higher proportion respec-
the study area.
tively of elevated blood pressure when compared to their
colleagues with normal BMI. This is important because
The findings from this study show that the twin problem
in
most cases these children are asymptomatic initially
of
underweight and OWOB was identified among the
and might only present later with end organ damage
study respondents. This is similar to what other re-
which have the potential of reducing their life expec-
searchers have reported in South Africa
29
as
well as in
tancy and quality of life.
39,40
In
order to curb this, health
25
and Anambra within
24
Uyo, Owerri,
15
Osun State,
10,30
screening for overweight and obesity amongst school
Nigeria. This shows that the double - burden of dis-
aged
children through full implementation and strength-
ease
as described is a burgeoning problem within the
31
ening of the school health services should be done.
study locale. This is of public health significance as it is
a
reflection of the potential disease burden that the
health systems within the study area may have to grap-
ple with. This burden would therefore likely consist of
Conclusion
the more traditional problems of infectious diseases as
well as illnesses resulting from malnutrition and under-
In
conclusion, the prevalence of overweight and obesity
weight and in addition face the impact of the non-
was 7.7% and 3.1%. Also, the prevalence of hyperten-
communicable diseases (NCDs) such as hypertension,
sion and elevated blood glucose was 3.1% and 2.1%,
diabetes and obesity that have been linked with child-
amongst school aged children and females had a higher
hood OWOB.
6,7,32
The prevalence of underweight in the
proportion of OWOB than males in Egor Local Govern-
study (11.8%) was lower than 17.0%, 17.3% and 22.7%
ment Area, Benin City, Nigeria. There is a need for pub-
reported for Owerri, Osun and Edo State in general
25
30
33
lic enlightenment towards promoting healthier lifestyle
which could possibly be because the study area is rela-
choices such as good nutrition and increased physical
tively better developed and more affluent than those
activities including screening of disease conditions early
combining rural settlements.
in
childhood. In addition, the use of fruits and nuts as
snacks should be promoted by making these readily
A
high proportion of the respondents took snacks in-
available in the homes instead of the less healthy alter-
between meals especially pastries. Few took either fruits
native of sugar sweetened beverages. This can be done
or
groundnut (legumes). The use of fruits and nuts as
by
encouraging home and/or community gardening.
snacks should be promoted and made readily available
in
the homes. Access to sugar sweetened beverages that
are
patronized by a high proportion of children, which
Conflict of Interest: None
was reported in this study should be minimized in order
Funding: None
to
reduce their consumption. Frequent consumption of

12
Acknowledgement
The
authors wish to express their gratitude to the people
of
Uselu community for the cooperation granted the
researchers during the study period.
Reference
1.
Maqbool A, Stettler N, Stallings
10.
Adegoke SA, Adeodu OO, Olowu
20.
Salman Z, Kirk GD, Deboer MD.
VA.
Nutrition. In: Kliegman RM,
WA,
Elusiyan JBE. Prevalence of
High Rate of Obesity-Associated
Stanton DF, Schur NF, Geme JN,
overweight and obesity among
Hypertension among Primary
Behrman RE editors. Nelson Text-
children in Ile-Ife. Department of
School children in Sudan. Int J
book of Paediatrics. 19 ed. Phila-
th
Paediatrics, Obafemi Awolowo
Hypertens 2011:629492.
delphia: Saunders Elseiver. 2011:
University Ile-Ife; 2009.
21.
Odenigbo UM, Nkwoala CC,
160.
(Unpublished report)
Okpala OC. Impact of birth
2.
Allison DB, Matz PE, Pietrobelli
11.
Ansa VO, Odigwe CO, Anah MU.
weight on the nutritional status
A,
Zannolli R, Faith MS. Genetic
Profile of body mass index and
and
academic performance of
and
environmental influences on
obesity in Nigerian children and
school age children. Paki
J Nutri.
obesity. In:Bendich A, Deckel-
adolescents. Niger
J Med .
2001;
2010; 9: 1157 1161.
baum
RJ, editors. Primary and
10: 78-80.
22.
Okoh BA, Alikor EA, Akani N.
secondary preventive nutrition.
12.
Musa DI, Toriola AL, Monyeki
Prevalence of hypertension in
Totowa NJ: Humana Press. 2001:
MA,
Lawal B. Prevalence of child-
primary school-children in Port
147-164.
hood and adolescent overweight
Harcourt, Nigeria. Paediatr
Int
3.
Federal Ministry of Health
and
obesity in Benue State, Nige-
Child Health . 2012; 32: 208 212 .
(Nigeria) Nutrition Division. Na-
ria. Trop
Med International
23.
Nwabueze AS, Ilika AL, Azuike
tional Policy on Infant and Young
Health. 2012; 17: 1365-1375.
EC,
Nwabueze NC, Obi KM et
Child Feeding in Nigeria.
13.
National Population Commission
al. Assessment
of nutritional
Abuja.2005.
(Nigeria). Population distribution
status among primary pupils in
4.
Lobstein T, Baur L, Uauy R. Inter-
by
sex, state, LGAs and senatorial
rural and urban areas of Anambra
national Obesity Task
districts: 2006 Census priority
State. Euro
J Preventive
Med,
Force: Obesity in children and
Table IV. Vol 3. Accessed May
2015;3(2): 34-38 doi: 10.11648/
young people: a crisis in public
2014. Available from
j.ejpm.20150302.14
health. Obes
Rev 2004;
1: 4-104.
www.population.gov.ng/.
24.
Nnebue CC, Ilika AI, Uwakwe
5.
St
Onge M P, Keller K L, Heyms-
14.
Cochran WG. Sampling Tech-
KA,
Duru CB, Onah SK et
al.
field S B. Changes in childhood
niques, 2nd Ed.,New York: John
Feeding practices and determi-
food consumption patterns: a cause
Wiley and Sons, Inc. 1963
nants of the nutritional status of
for
concern in light of increasing
15.
Opara DC, Ikpeme EE, Ekanem
pupils in a public primary school
body weights. Am
J Clin
Nutr
US.
Prevalence of stunting, under-
in
Aladinma Owerri, Nigeria. Intl
2003;78:1068 1073.
weight and obesity in school aged
J. Clin Nutrition, 2016; 4(1): 12-
6.
WHO. Prioritizing areas for action
children in Uyo, Nigeria .
Pak. J
18 doi: 10.12691/ijcn-4-1-3
in
the field of population-based
Nutr . 2010; 9:459-466.
25.
Ben-Bassey UP, Oduwole AO,
prevention of childhood obesity: a
16.
Han ST, Sattar N, Lean M. Assess-
Ogundipe OO. Prevalence of
set
of tools for Member States to
ment
of obesity and its clinical
overweight and obesity in Eti-Osa
determine and identify priority
correlation. BMJ.
2006; 333:
695-
LGA, Lagos, Nigeria. Obes
Rev.
areas for action. Accessed January
698.
2007; 8:457-459.
2015. Available from
17.
Timmis A. Cardiovascular System.
26.
Sabageh AO, Ojofeitimi EO.
www.who.int/dietphysicalactivity/
In:
Sawash M, Glynn M eds. Hut-
Prevalence of obesity among
childhood/Childhood_obesity.
chinsons Clinical Methods, an
adolescents in Ile- Ife, Osun
7.
Singh AS, Mulder C, Twisk JW,
integrated approach to clinical
State, Nigeria using body mass
van
Mechelen W, Chinapaw MJ.
practice. Sunders Elseiver: USA.
index and waist hip ratio: a com-
Tracking of childhood overweight
2007:77.
parative study. Niger
Med J.
into adulthood: a systematic re-
18.
Olusanya O, Okpere E, Ezimokhai
2013; 54: 153-156.
view of the literature. Obes Rev .
M.
The importance of social class
27.
Federal Ministry of Education
2008; 9: 474-88.
in
voluntary fertility control in a
(Nigeria). National School Health
8.
World Health Organization. Popu-
developing country. West
Afr J
Policy. Abuja, 2006. Accessed
lation-based prevention strategies
Med . 1985;4:205-212.
May
2015. Available from
for
childhood obesity: report of a
19.
WHO. Growth reference data for 5
www.unicef.org/nigeria/
WHO
forum and technical meet-
-19
years. Accessed June 2014.
school_health_policy.pdf.
ing, Geneva, 15 17 December
Available from www.who.int/
28.
Toriola AL, Moselakgnmo VK,
2009.Geneva: World
Health
growthref/en/ National Institute for
Shaw BS Goon DT. Overweight,
Organization; 2010.
Health (USA). Blood pressure
obesity and underweight in rural
9.
World Health Organization. Obe-
levels for boys and girls by age and
black South African children. S
sity: Preventing and Managing the
height percentile. Accessed June
Afr J Clin Nutr . 2012; 25: 57- 61 .
Global Epidemic. World Health
2014. Available from
Organization Technical Support
www.nhlbi.nih.gov
Series 894: World Health Organi-
zation Geneva, Switzerland. 2000

13
29.
Adeomi AA, Adeoye OA,
33.
Ansa VO, Anah MU, Ndifon WO.
36.
Chiolero A, Gray M, Anderson
Bamidele JO, Abodunrin OL, Odu
Soft drink consumption and over-
G,
Burnier M, Paccaud F et al.
OO,
Adeomi OA. Pattern and de-
weight/obesityamong Nigerian
Prevalence of elevated blood
terminants of the weight status of
adolescents. CVD
Prevention
pressure and association with
school-age children from rural and
Control, 2008: 3: 191-196
overweight in children of a rap-
urban communities in Osun State,
34.
Rezaeian S, Ahmadzadeh J, Es-
idly developing country. J
Human
Nigeria: a comparative study. J
mailnasab N, Veisani Y, Shayan
Hyperten . 2007; 21:120-127.
Med Nutr Nutraceuticals, 2015; 4
M,
Moradi N. Assessment of
37.
Scott IU, Siatkowski RM, Eneyin
(2):107-114
Health and Nutritional Status in
NM,
Brodsky MC, Lam BL. Idio-
30.
Theobald NS, Suchindran C, North
Children Based on School Screen-
pathic intracranial hypertension in
KE,
Popkin BM, Gordon-Larsen P.
ing
Programs. Health
Scope, 2014;
children and adolescents. Am J
Association of adolescent obesity
3(1): e14462 doi: 10.17795/
Opth . 1997; 124: 253-255.
with risk of severe obesity in adult-
healthscope-14462
38.
Lindhal BI, Jihansson LA. Multi-
hood. JAMA .
2010; 304(18):2042-
35.
WHO. Prioritizing areas for action
ple
cause-of death data as a tool
7.
in
the field of population-based
for
detecting critricial trends in
31.
Gunnell DJ, Frankel SJ, Nanchahal
prevention of childhood obesity: a
the
underlying cause statistics: a
K,
Peters TJ, Snith GD. Childhood
set
of tools for Member States to
methodological study. Scand
J
obesity and adult cardiovascular
determine and identify priority
Soc Med . 1994; 22: 145-158.
mortality: a 57 year follow up
areas for action. Accessed January
39.
Franks PW, Hanson RL, Knowler
study based on the Boyd Orr co-
2015. Avaliable from
WC,
Sievers ML, Bennett PH et
hort. Am
J Clin
Nutr , 1998;
67(6):
www.who.int/dietphysicalactivity/
al.
Childhood obesity, other car-
1111- 1118.
childhood/Childhood_obesity.
diovascular risk factors and pre-
32.
Edo State Ministry of Health. Edo
mature death. N
Engl J
Med .
State Government 2010-2020 Stra-
2010; 362:485-493
tegic Plan: Edo State Basic health
and
social data. 2009; 1- 121.